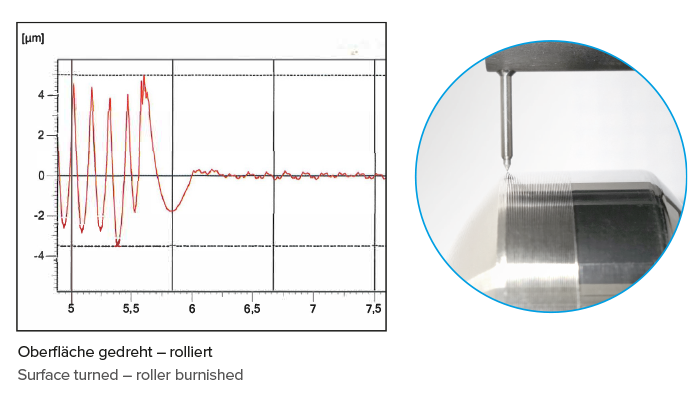
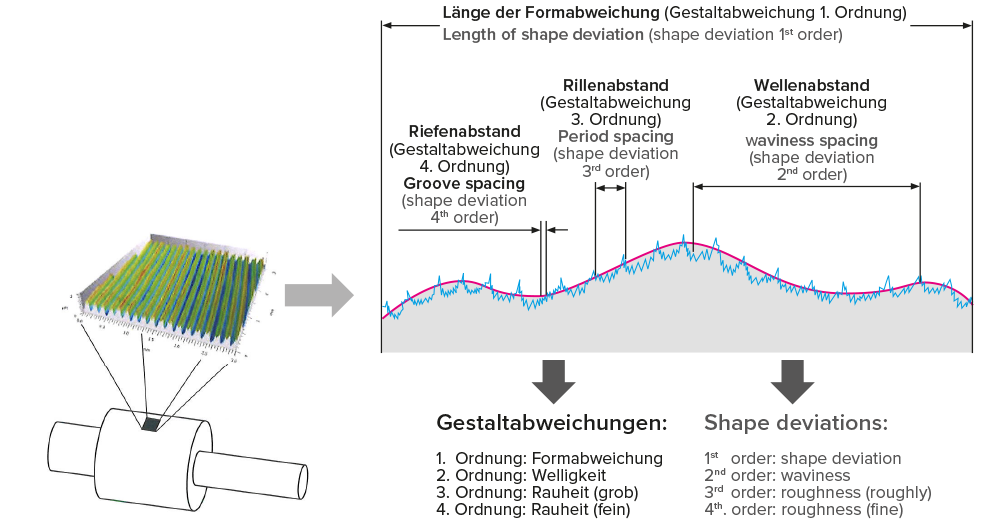
Every machined surface has a typical structure shaped by the cutting geometry and the cutting feed. The shape of the existing surface has a decisive influence on the result of the roller burnishing process. Surfaces are measured, for example, using the stylus method. In this process, a defined probe (e.g. a diamond cone with a tip radius of 0.2 μm) is drawn across a standardised measuring section at right angles to the processing direction and the surface profile is recorded.By means of standardized filters, the different orders of the shape deviation are displayed separately from each other. In reality every surface deviates more or less from the ideal surface (without deviation of dimension, form and shape).
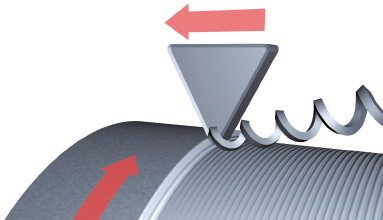
TURNING
Surfaces created by geometrically defined cutting edges
- Constant periodic profile
- Constant roughness
- Marked profile peaks
The results are very stable conditions for a roller burnishing process.
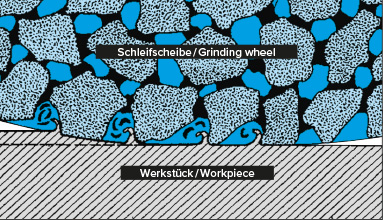
GRINDING
Surface created by geometrically undefined cutting edges
- Irregular profile
- Low roughness with „single kerfs“
- Plateau formation
The results are higher rolling forces and smaller changes in dimensions during rolling.
Introduction to the topic of roughness
When characterizing surfaces, ISO 21920-2:2021 distinguishes between various shape deviations, starting with shape deviations, through waviness and various degrees of roughness, to deviations in the lattice structure of the material. Surface metrology deals with the medium and short-wave components of the shape deviations of workpieces (waviness and roughness).
We would like to take this opportunity to thank the Steinbeis Transfer Center and Prof. Dr.-Ing. Dietmar Schorr for their support in creating the chapter on surface quality. The following information is courtesy of the Roughness and Roughness Measurement seminar.
www.steinbeis-analysezentrum.com
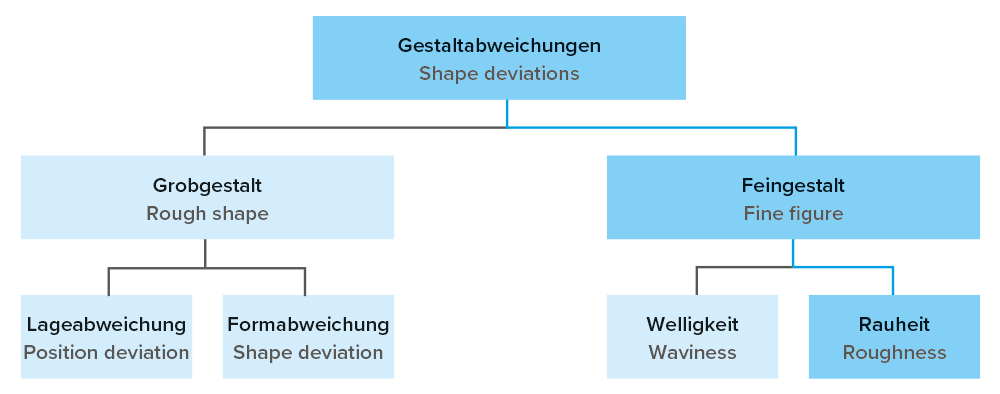
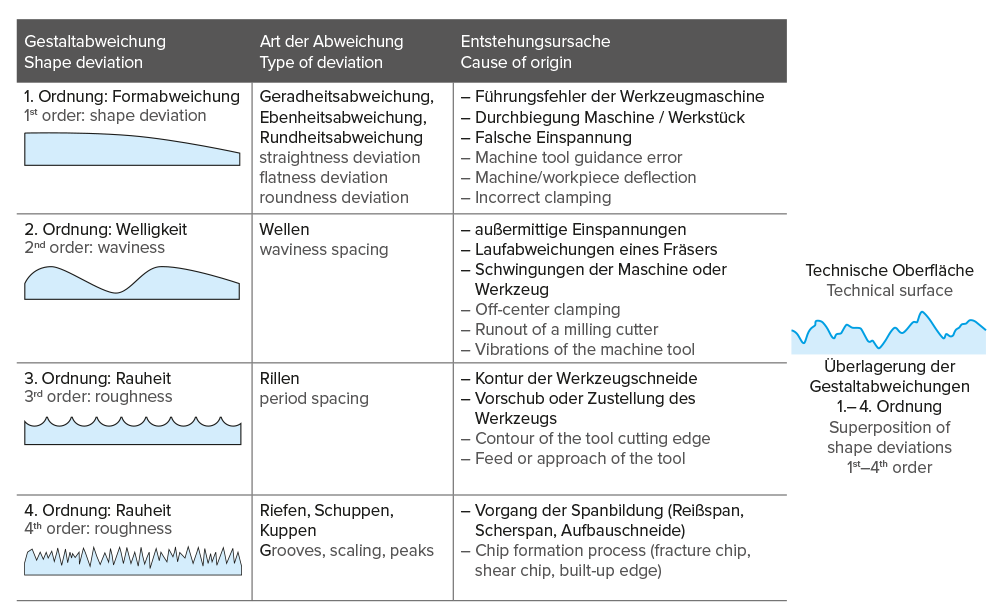
SHAPE DEVIATIONS
DIN 4760:1982 defines the shape deviations. A difference is made between shape deviations in coarse shape and fine shape deviations. The waviness is assigned to either the coarse shape or the fine shape.
SURFACE CONDITION
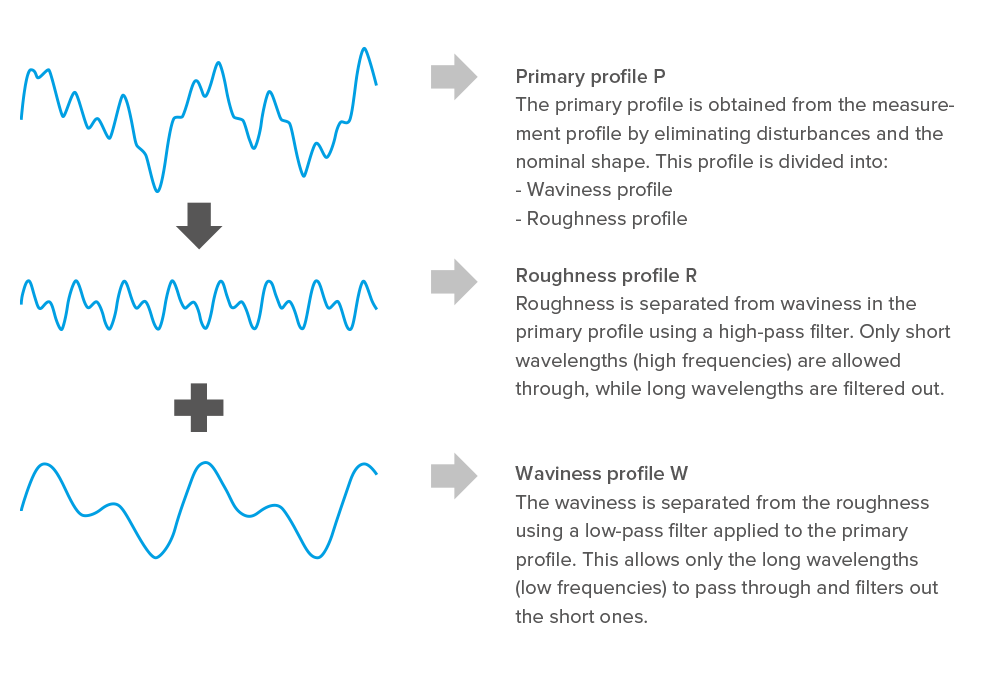
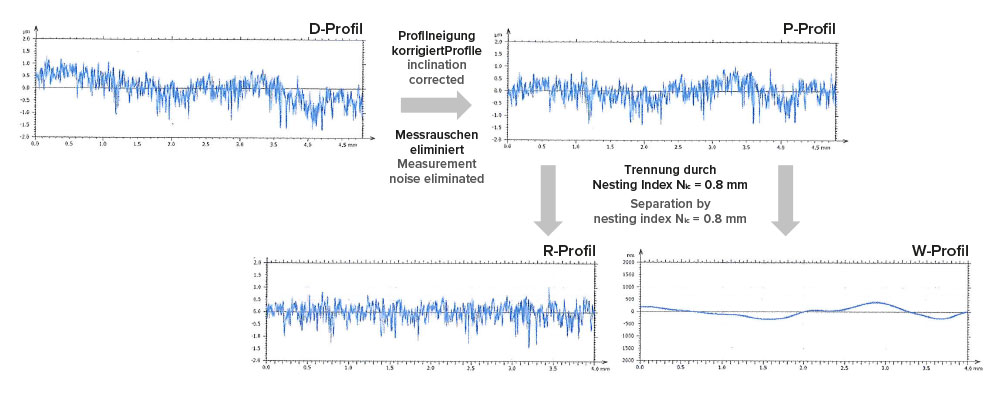
The actual measured overall profile of a surface is broken down into a long-wave component (waviness profile) and a short-wave component (roughness profile R) using appropriate filtering techniques.
MEASURING CONDITIONS
Surface profiles: Profile composites (D-, P-, R-profile and shape)
- The R-profile contains the short-wave profile components.
- The W-profile contains the long-wave profile components.
The following parameters have proven useful for characterizing surfaces in the area of smoothing tools:
- Ra (arithmetic mean of all ordinate values)
- Rz (maximum height)
- Rzx (maximum height in the section)
- Rp (average peak height)
- Rv (mean valley bottom depth)
- Rt (total height)
- Rsk (Slope)
- Rmr (p, dc) (relative material ratio)
- Rpk (Reduced peak heights)
- Rk (core height)
- Rvk (reduced valley depth)
We describe these parameters on the following pages. However, they are only a small excerpt from the technical regulations ISO 21920-2:2021
PROFILE-PARAMETERS 2D
Roughness profile: Height parameters – Average values
- Ra: Arithmetic mean of the height of the roughness profile.
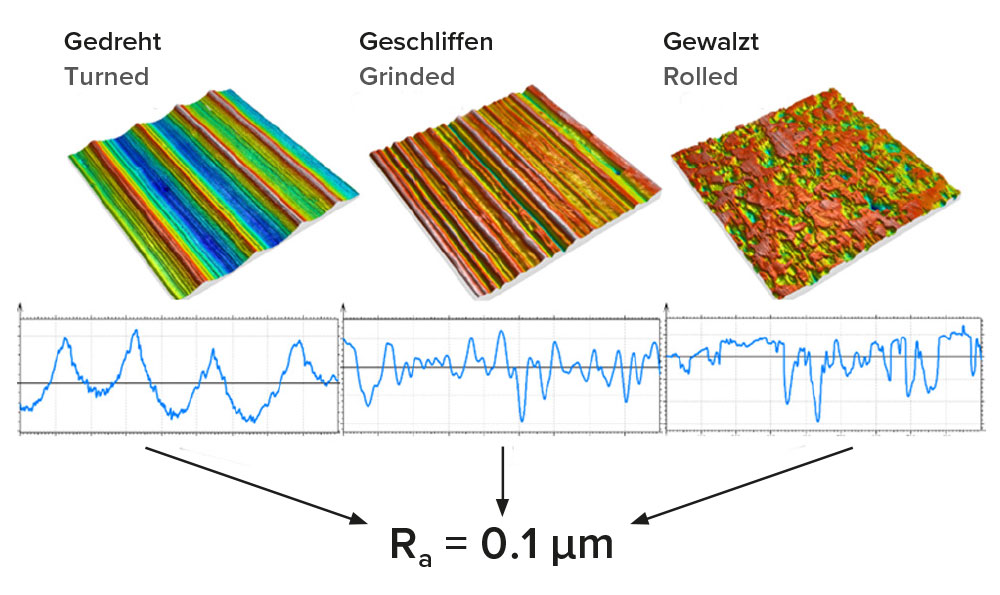
Ra was not introduced because it was meaningful, but because it was measurable.
Ra is an unsuitable parameter for characterizing surface microstructures!
- Early profilometers with RC circuits were not yet able to calculate the more complex value Rq (root mean square). Therefore, Ra, the simple arithmetic mean, became established.
- Advantage: Easy to calculate
- Disadvantage: Blind to peaks, valleys, and functional properties of the surface
Weingraber, Herbert; Abou-Aly, Mohamed: Handbook of Technical Surfaces. Wiesbaden: Vieweg+Teubner, 2012.
ROUGHNESS-PROFILE
Rz (maximum height) (ISO 21920-2:2021)
Mean value of the sum of the greatest peak heights and greatest valley depths (= height of the profile elements) within a section length Isc over all sections nsc in the evaluation length Ie.
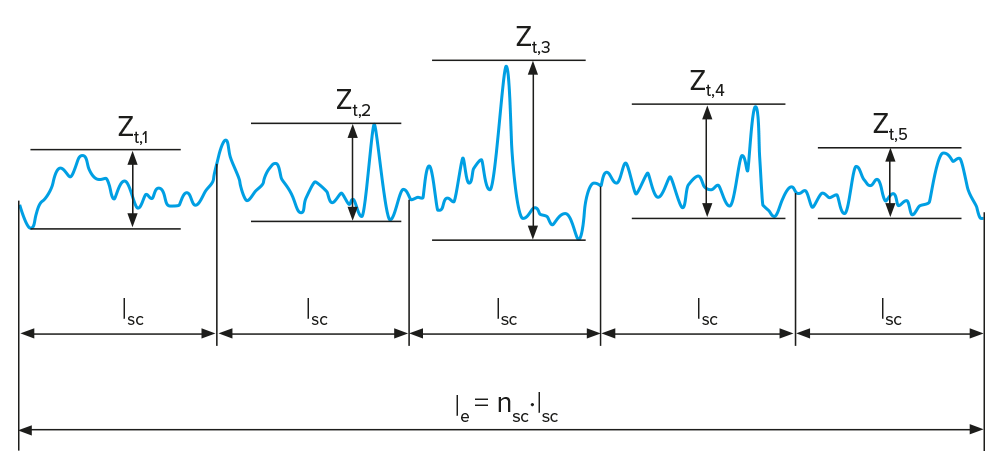
Number of sections (as a rule): nsc = 5
The maximum height of the roughness profile Rz (old: average roughness depth) is usually approx. 3–10 times greater than the arithmetic mean value of the roughness profile Ra. However, there is no generally valid conversion and certainly no correlation between Rz and Ra.
Rzx (maximum height in the section) (ISO 21920-2:2021)
Largest difference between the highest and lowest values within a section length Isc that moves over the evaluation length Ie
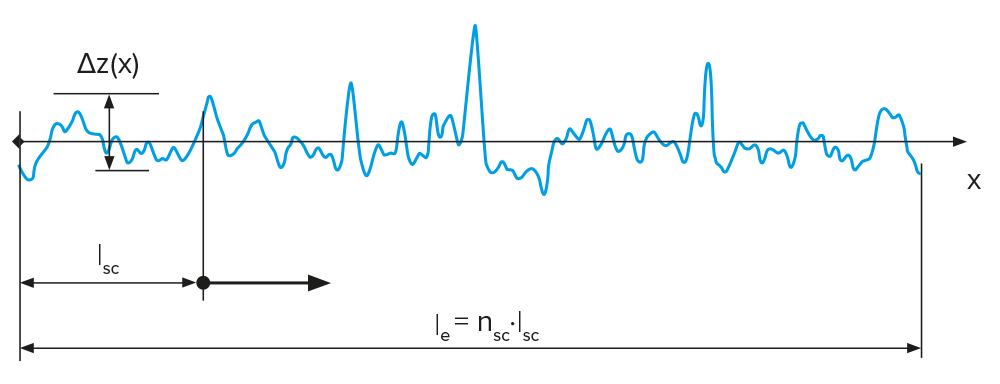
The maximum height in section Rzx can be determined if the evaluation length is at least as long as a section length.
The ratio Rzx / Rz provides information about outliers in the profile
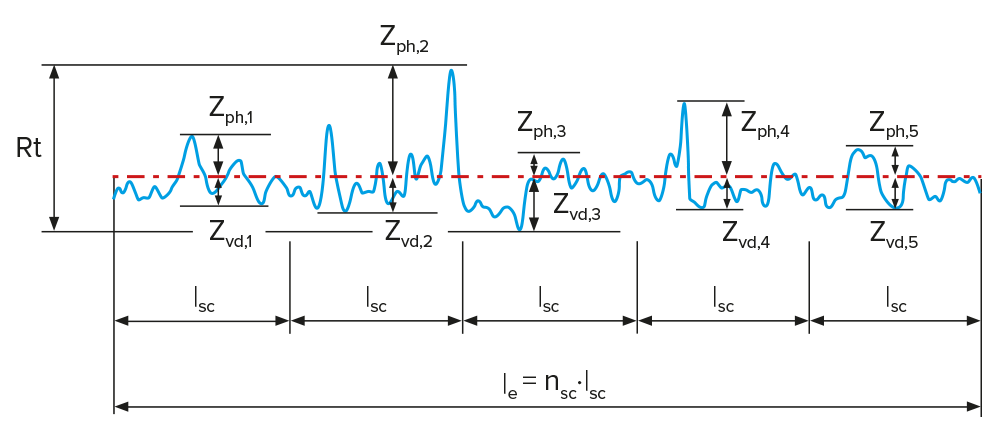
The mean peak height Rp and the mean valley depth Rv are the mean values of the respective highest peak heights Rpi and valley depths Rvi of the R profile within the section length Isc.
The total height Rt refers to the entire evaluation length Ie , i.e. the difference between the highest peak and the deepest valley within this length.
ROUGHNESS-PROFILE: Height parameters
MEANING of Rp und Rv

Surface has pronounced peaks
→ plastic deformation of the tips
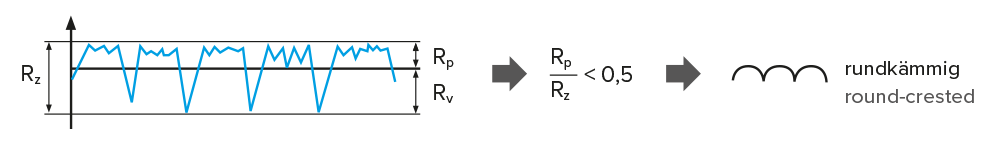
Surface consists mainly of a plane with deep, narrow valleys
→ elastic deformation of the peaks
Rsk (Skewness)
The skewness is a parameter that represents a measure of the asymmetry of the height density.
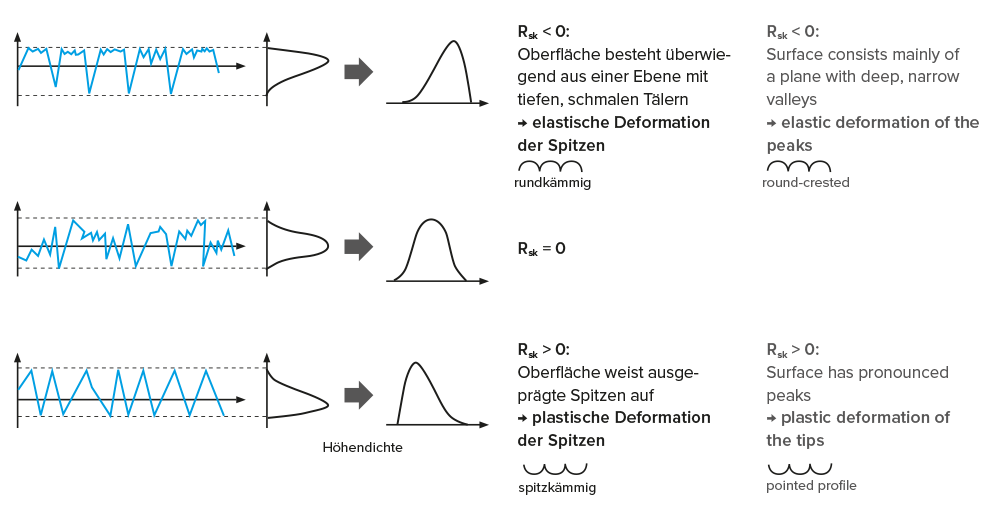
Round-crested profile
If the skewness Rsk < 0, the profile consists of pronounced planes and few pronounced valleys. This leads to a high contact ratio and, for lubricated systems, to the stable formation of a hydrodynamic load-bearing film. These profiles are less prone to wear.
Pointed profile
If the skewness Rsk > 0, this indicates pronounced surface peaks. These are plastically deformed or broken off in tribological contact. This in turn is associated with strong running-in behavior with functional changes to the surface and particle formation. These profiles tend to have a higher coefficient of friction.
ROUGHNESS PROFILE: Material proportion parameters
Rmr (p, dc) (relative material proportion):
Material proportion in a cutting height cp + dc
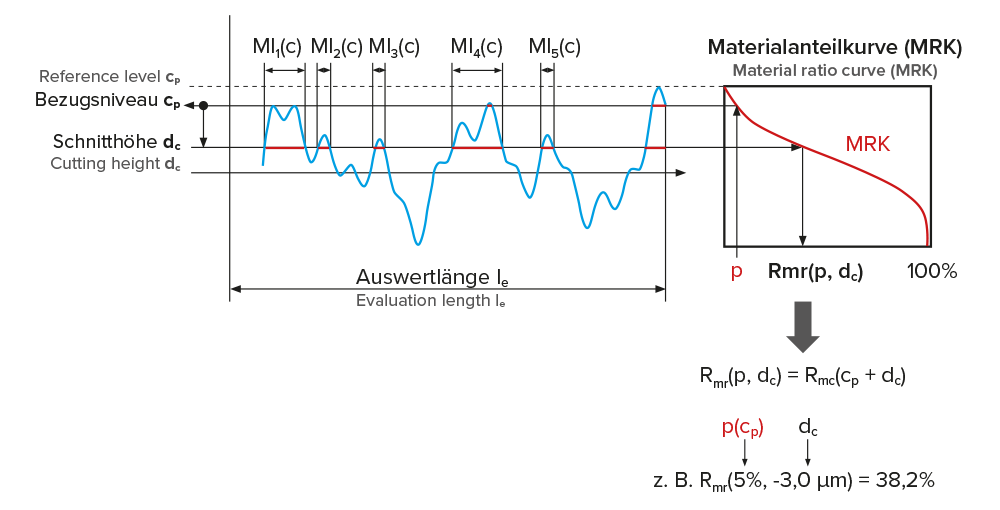
The reference material proportion p should be in the range 2-5% and serves to eliminate the dependence of the calculation of the relative material proportion on a single surface peak.
Reference level cp = inverse material proportion with a material proportion p
The cutting height should be set so that the resulting values for Rmr allow a differentiation of the product quality. As a guide, the cutting height should be approx. 25% of the maximum height of the roughness profile Rz It should be noted here that this refers to the average roughness value of the Rz of the components to be measured and not that the cutting height c = Rz/4 is recalculated for each component or each measurement and would therefore vary.
ROUGHNESS-PROFILE: Characteristics for plateau-like surfaces
Rpk (reduced peak height):
Height of the peaks that lie above the core profile (Rk).
Rk (core height):
Height of the central roughness or actual roughness of the profile. This is the height of the roughness profile without very high hills or very deep valleys.
Rvk (Reduced valley depth):
Depth of the valleys that lie below the core profile (Rk).
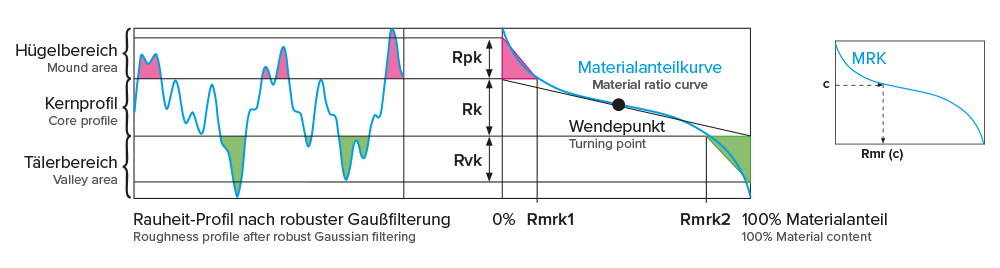
The material ratio curve (MRC) indicates the total material ratio Rmc(c) in % at a specific cutting height c. The MRC can be used to assess the wear behavior and load-bearing capacity of a surface using the parameters for plateau-like surfaces.
The default for the profile L filter for Rpk, Rk, Rvk, Rmrk1, Rmrk2, Rak1, Rak2 is the robust second-order Gaussian filter according to ISO 16610-31:2016. This is advantageous for plateau-like surfaces.
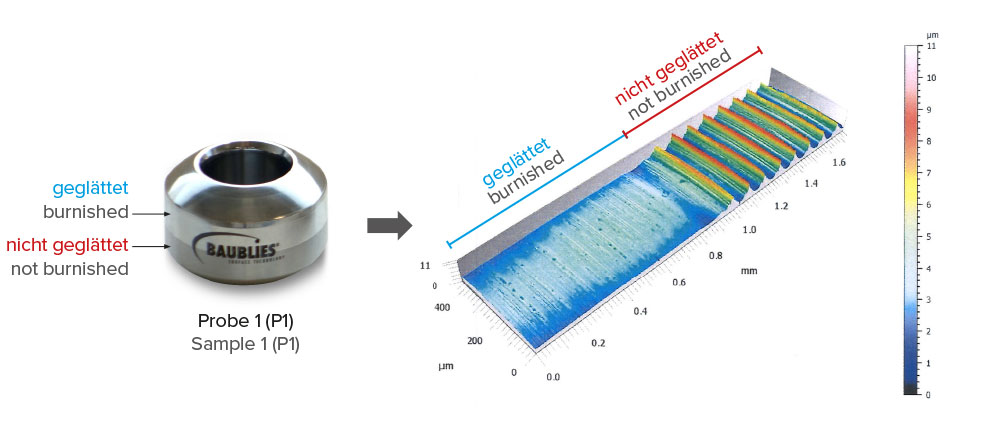
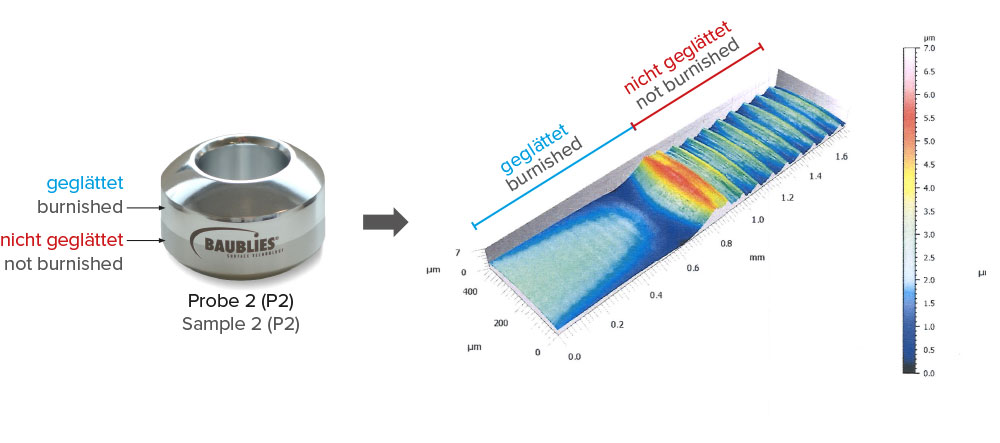
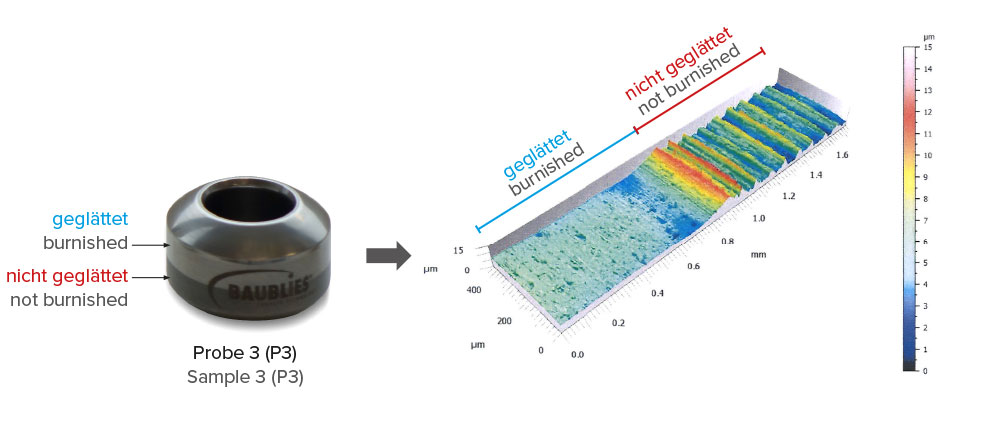
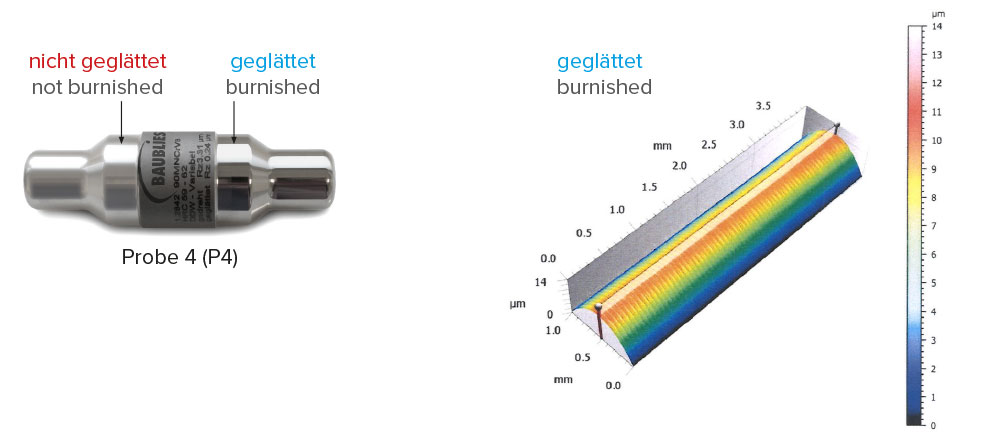
ANALYSIS OF SMOOTH ROLLED SAMPLES 3D
Summary of results
- The area-related average roughness depth S10z of the surfaces was reduced by between 64% and 85% by smooth rolling.
- The peaks (S5p) as well as the valleys (S5v) are reduced by 49% to 87% depending on the samples, with no major discrepancies between the reduction of peaks and valleys in samples 1-2 (2-6%). In sample 3, the peaks (at 79%) are 30% more reduced than the valleys (at 49%)